
There is nothing that maintenance managers want more than having assets up and running 100% of the time and with no breakdowns to report. The problem is that this objective is impossible to achieve: we are unable to prevent or predict all breakdowns, however good our preventive maintenance plan is.
So, what is our best attack plan? What is the best way to avoid the frustration of having a damaged critical asset? A preventive maintenance plan that is as balanced as possible, that protects the company’s main assets, reduces maintenance costs and ensures that everything runs smoothly.
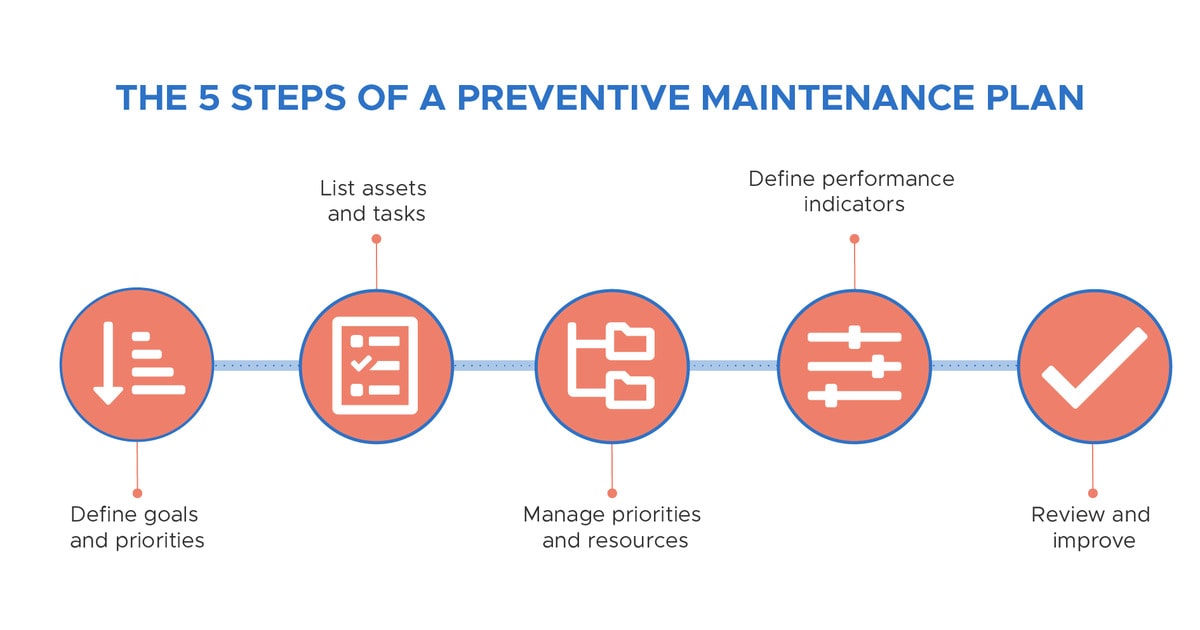
If it seems complex, make it simple: we will explain how to create a maintenance plan in 5 steps.
→ Before we get into the details, we recommend reading our Ultimate Guide to Peventive Maintenance.
1. Set goals and priorities
The first step in creating a maintenance plan is to define the final goal. What’s your purpose? To save money with maintenance? To avoid breakdowns that have compromised the normal functioning of the company in the past? To protect expensive equipment that you cannot easily replace?
Having clear goals is essential, because without them you will not be able to establish priorities, and without priorities you will not be able to allocate resources. In a factory, for example, the main objective is to keep the entire production line up and running – more than saving money on lift or air conditioning maintenance.
There is no universal recipe. Your goals may even change depending on the company’s financial moment or due to external factors. We just had a good example: during the COVID-19 pandemic, many hotels reduced preventive maintenance to minimum services.
Also think about what has failed to achieve these goals. Lack of technicians? Lack of communication between departments? Did you miss the deadlines? You didn’t have spare parts to solve the malfunction? Is the current maintenance software insufficient? Perhaps you need comprehensive facility management software to better coordinate all aspects of your operations. Or could the malfunction not be prevented at all?
Modern maintenance management requires sophisticated tools to track assets, schedule tasks, and ensure compliance. A comprehensive cafm system can provide the foundation for effective preventive maintenance planning across all your facilities. Without the right technological infrastructure, even the best-intentioned maintenance plans can fall short of their objectives.
| 💡 The greatest return of preventive maintenance will be on assets with predictable behaviour, that is, that need maintenance after x amount of time or y usage cycles (for example, air conditioners, elevators, water heaters, car fleets, exhaust fans, cold chambers). |
2. Do an asset inventory and a task list
The second stage of the preventive maintenance plan is to map the assets, divided by equipment families. It is easier to map visually if you use an IMMP (Intelligent Maintenance Management Platform) with that functionality, or dedicated asset management software that provides comprehensive asset tracking capabilities.
When inventorying assets, be sure to also compile the following information, which can be efficiently organized using inventory management software:
- warranty terms
- the manufacturer’s recommendations or user manual regarding equipment maintenance (for example, frequency of maintenance, expected service life, ideal temperature and humidity conditions, manufacturer’s contacts)
- data from previous checks to verify the operation of the equipment
- data from previous repairs, especially if parts were replaced
- asset criticality
- legal requirements.
Consider the following example (Example 1):Building Name: Building 8 PMP Year: 2020 Equipment Family: Hot Water Boilers Asset: Hot water boiler #1 Brand/Manufacturer: Boilers Manufacturers, Ltd. Warranty term: March 2021 Manufacturer’s recommendation: general maintenance one month before the cold season, in order to be fully operational in winter. At the time of greatest use, a general inspection is recommended every 3 months. Last inspection: May 2020 Criticality: Class C Legal requirements: n/a (Note: For assets with regulatory requirements, compliance management software can help ensure all legal obligations are met) |
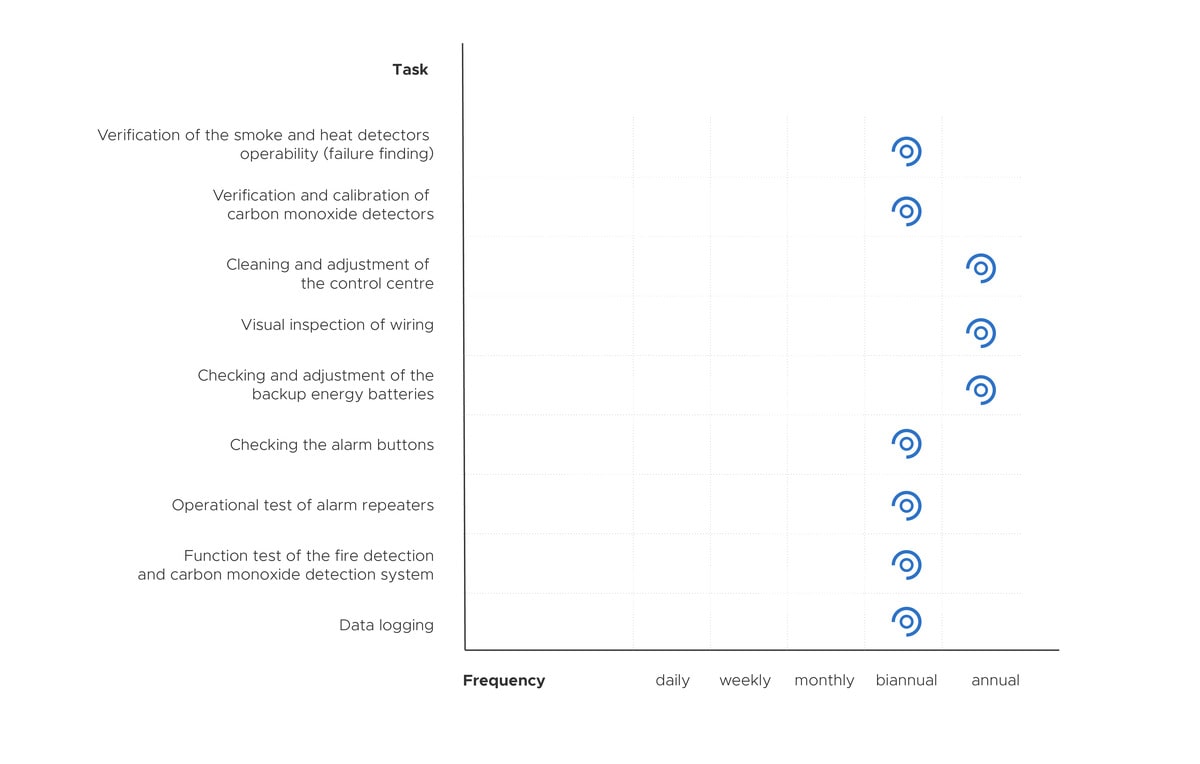
All of this information will determine how often you need to do preventive maintenance: daily, a few times a week, weekly, bimonthly, monthly, quarterly, biannual or annual.
Example 2Building Name: Building 8 PMP Year: 2020 Equipment Family: HVAC Rooftop Asset: air conditioning rooftop bar |

Example 3Building Name: Building 8 PMP Year: 2020 Equipment Family: Fire Detectors Asset: kitchen fire detectors |
⚠️ Again, this step is easier if you are using an Intelligent Maintenance Management Platform (IMMP). In that case, you can schedule the tasks automatically, according to the desired frequency. In addition, you can associate each task to the responsible technicians, which helps you to define the maintenance schedule in more detail and move faster in step 3.
3. Manage priorities and resources
In the previous steps, we defined our long-term goals and the ideal frequency for each preventive maintenance measure. Now, it’s time to do a “reality check” on our maintenance plan. We need to translate our goals to the short term, depending on the time and resources we have.
- From step one, we already know which assets we should prioritise.
- From step two, we already know which assets are most critical.
So, let’s fit the list into the preventive maintenance plan:
- preventive maintenance actions on the most critical assets (Class A), the breakdown of which most affects our objectives;
- preventive maintenance actions on assets that are important to the company, but whose eventual breakdown impairs less the normal functioning of the company (Class B criticality);
- failure-finding maintenance actions (tests and checks) on critical assets;
- all other preventive maintenance and condition-based maintenance actions on less critical assets;
- scheduled reactive maintenance (less critical assets, class C, which do not justify the investment in preventive maintenance).
By now the maintenance plan is almost complete, but you still need to manage human resources and assign tasks to the right teams. This is where field service management software becomes invaluable for coordinating technicians and work orders. For this, we will separate tasks in order of difficulty and divide the maintenance actions into 5 levels:
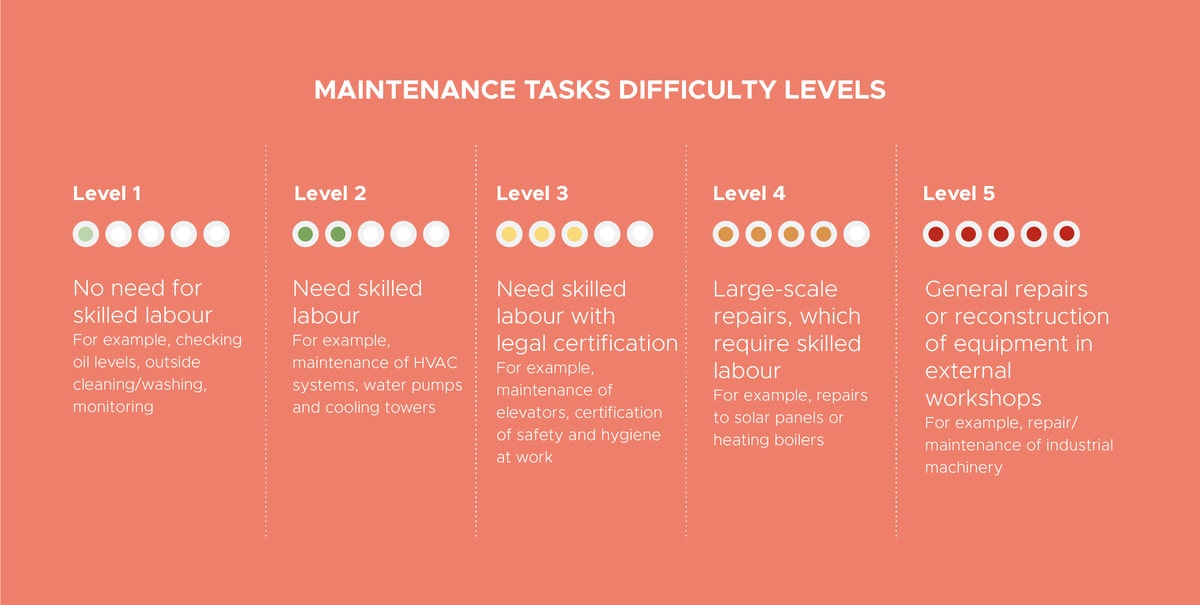
In preventive maintenance, almost all tasks are between level 1 and level 3. Usually, level 1 tasks can be performed by the equipment users themselves or by internal labour. Level 2 and 3 tasks fall within what we call “maintenance contracts” – outsourcing. Ideally, there is no need to perform level 4 or 5 tasks, unless we are talking about an industrial maintenance plan with heavy equipment.
When making your maintenance plan, we suggest making a list and reviewing all these contracts, as they represent fixed costs and a good part of the level 2 and 3 tasks.
- Is there a level 1 service that an external supplier is in charge of and that can be done internally with a better cost-benefit ratio?
- Is there a level 2 task so recurring that it justifies hiring qualified technicians, instead of resorting to maintenance contracts?
- Are there any tasks that you need to assign to an external supplier, so that your technicians can dedicate themselves to other goals?
- Do maintenance contracts provide all the coverage you need?
- Are external companies fulfilling all tasks in your plan?
- Do you need to look for new suppliers for some service?
- Is communication with external suppliers fluid?
| 💡 Among the tasks you assign to your team, remember to leave 10% of time available for unplanned maintenance – this will allow you to stick to your plan even when there are unforeseen events. |

4. Create KPIs for the preventive maintenance plan
If you have set goals, now you need to know if you have achieved them. You must define performance indicators (KPIs) upfront, in order to monitor the progress and effectiveness of the maintenance plan. Some of the most common indicators are as follow:
- percentage of preventive maintenance;
- compliance rate of preventive maintenance;
- general efficiency of the equipment;
- the critical percentage of scheduled maintenance;
- average time between breakdowns;
- total maintenance cost (including labour, materials, maintenance contracts);
- and, of course, the ROI.
If your team is always keen to enter data into the maintenance software, modern cmms software can calculate the KPIs automatically throughout the process.
5. Review and improve
Nothing is perfect! When reviewing the maintenance plan, KPIs and reports, consider whether:
- do you really need all the preventive maintenance actions you did, or do some fail to pay back?
- did any asset perform below expectation?
- were all breakdowns inevitable or could some have been avoided with preventive maintenance?
- the risk level of each asset remains the same, or is there any equipment that is wearing out quickly and needs additional maintenance?
And… start over!
How to measure the effectiveness of your preventive maintenance plan
There are three performance indicators that help you measure the efficiency of your planned preventive maintenance — the planned maintenance percentage, the preventive maintenance compliance rate, and the critical scheduled maintenance percentage — that tell us if you are really succeeding or not. And since there’s always the other side of the coin, they also give us an indication of the reasons why your planned preventive maintenance may not be working.
Planned Maintenance Percentage
If the indicator analysis of a preventive maintenance plan was like a health checkup, the planned maintenance percentage would be like a hemogram – a routine test that we should do regularly and that is a good indicator of the state of our immune system. Besides, calculating the planned maintenance percentage isn’t that hard. Simply divide the number of hours you spend on planned preventive maintenance by the total hours spent on maintenance in total (thus including reactive maintenance). Here’s the formula:
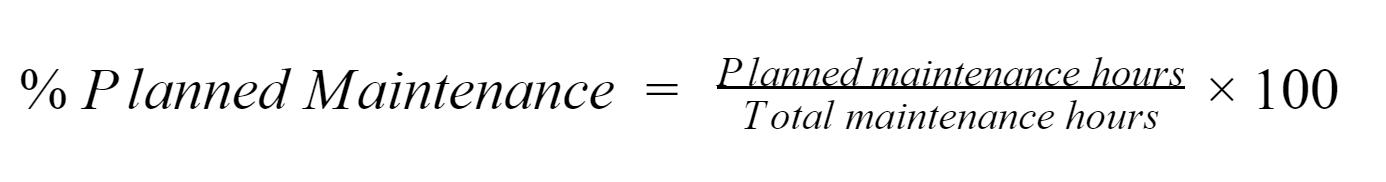
If the planned maintenance percentage is less than 85%, your company needs to take more exams and perhaps an emergency trip. But what does a low planned maintenance percentage mean?
Lack of focus on preventive maintenance
If your planned maintenance percentage is less than 85%, it means that you are spending at least 15% of your time on reactive maintenance. In other words, your maintenance technicians spend 15% of their time fixing faults that could have been prevented.
Preventive Maintenance Compliance
If your company already has a preventive maintenance plan, it is the Preventive Maintenance Compliance (PMC) that tells us if your preventive maintenance plan is efficient or still needs some adjustments.
It is calculated by dividing the number of tasks performed by the number of planned tasks and multiplying it by 100. Often times, the most difficult thing is knowing exactly what was performed, but we trust you know by now that an Intelligent Maintenance Management Platform is a maintenance manager’s dearest friend. Here’s the formula for PMC:
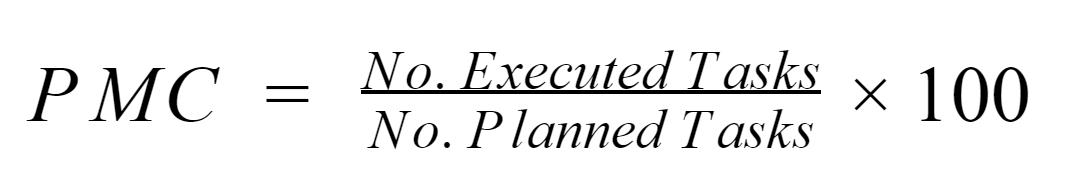
The preventive maintenance plan compliance rate should be 90% to avoid downtime and unnecessary maintenance repair expenses. Lack of compliance with the maintenance plan may indicate that:
You are not using the right technology
It’s impossible to stick to your preventive maintenance plan if you don’t have the right tools with you. Can you imagine a surgery where the surgeon has to leave the room halfway through to get a scalpel? It is important that your technicians have easy access to all the information about the equipment they are going to work on. Excel sheets were a big improvement over paper sheets, but they don’t send reminders, keep track of equipment malfunctions, or facilitate communication between different teams.
You are not optimising your resources and/or your team is inadequately trained
When defining your planned preventive maintenance for your technicians to perform, try putting yourself in their shoes. It is important to understand the routine of these employees in order for them to optimise their time. On the other hand, you may not be making the best use of your employees’ skill set either. Older people have experience to their advantage, but younger employees may be better at dealing with new technology. Understand their strengths and assemble teams that complement each other.
Scheduled maintenance critical percent
The last indicator we want to talk about is the scheduled maintenance critical percent — that is, the percentage of planned preventive maintenance you are doing late. Firstly, we need to break down maintenance tasks into cycles (for example, of 30 or 90 days). Then, we measure whether those days were enough to comply with the plan and, if not, how many extra days it took to complete the tasks:
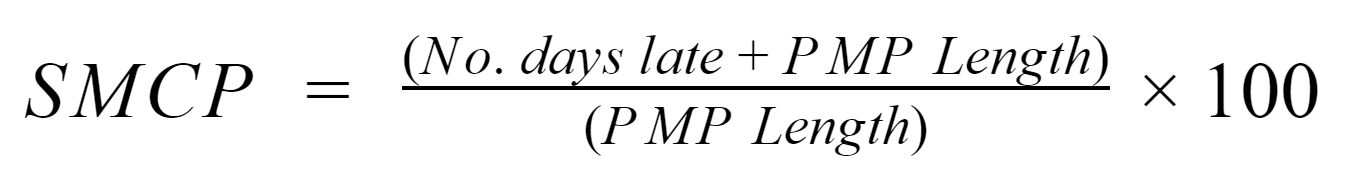
The critical percentage of scheduled maintenance should be as low as possible. Ideally, there would be 0 days of delay, so the metric would be 100%. But if under normal circumstances, you have many overdue tasks, this is probably a sign of:
Poor task weighing
When certain tasks (for example, the overhaul of all building climate control devices) constantly have a high SMCP, they are probably taking longer than expected or there aren’t enough technicians. In the future, you should aim to allocate more time and human resources to the tasks with the highest SMCP.
Poor priority setting
If any tasks that have a significant impact in your operation are constantly left to-do after their due date, you should reconsider your task prioritisation. Evaluate the criticality of your assets and move the top priority tasks to the top of the list, rather than “burying” them under half a dozen tasks with less impact.
These metrics will surely help you measure the effectiveness of your maintenance plan and understand what factors are affecting the execution of your tasks.
Ready to make a maintenance plan, but you don’t have a maintenance software? Talk to one of our experts and find out how Infraspeak can help you create and manage preventive maintenance plans intelligently.