
In maintenance, we determine key performance indicators (better known as KPIs) in order to measure the performance of a given task.
They can measure anything from the time that elapsed during a shutdown (whether it is due to programmed maintenance or not) to the evolution of production processes.
Maintenance key performance indicators (KPIs) vary according to the company, its goals, strategies and action plans. However, there is a set of indicators that is well-regarded and used more often.
If you’re a technician or a maintenance manager who’s still deciding what those indicators may be, use a SMART framework: Specific, Measurable, Attainable, Realistic and Timely.
In other words, your strategy should be:
- specific, meaning it will prioritize simple yet effective KPIs that can prevent mistakes you’ve made in the past;
- measurable, so that you can apply quantitative methods to confront achievements against the plan;
- attainable, because setting goals above your team’s capacity is pointless;
- realistic, taking into consideration current conditions and not just the desirable ones;
- timely, which calls for a reasonable timeframe.
What are the best maintenance KPIs?
Even though KPIs are closely related to the performance level you want to achieve, don’t take them for goals themselves. Do not forget that an indicator is only a metric, used as a quantitative method to determine the performance of a given maintenance activity, asset or department.
Additionally, indicators may be divided into two categories: first, those which showcase the impact of proper maintenance management in the overall business performance; and second, those that concern the reliability and availability of assets. Hence, we can highlight the following KPIs for maintenance management: downtime, backlog, MTBF, MTTR, OEE, PMP and Schedule Compliance.
Modern maintenance management relies heavily on technology solutions, with facility management software playing a crucial role in tracking and optimizing these key performance indicators across all maintenance activities.
We will now go over their respective uses, benefits and average values.
1. Downtime
This maintenance indicator tracks, monitors and evaluates the asset’s reliability, making it essential for any asset management software implementation.
Downtime tracks the total time equipment was unavailable or offline, which means an undesired event occurred and it will require some kind of intervention. You can use this KPI whether there’s already a maintenance plan in place for that asset or not. It’s also a variation of the Planned Maintenance Percentage, which we’ll cover below.
Your aim for this key performance indicator should be 10%. This means the asset should be fully operational (also called “uptime”) around 90% of time so that production won’t shut down. The lack of infrastructure, monitoring and planning are usually what drives higher downtime percentages.
This indicator can help you establish a preventive maintenance strategy with the goal of keeping downtime below average, as well as minimizing the effect of unplanned shutdowns. Remember that when an asset isn’t working, there isn’t any output – which ultimately leads to losses.
📝 You may also like: What is First-Time Fix Rate and how to improve it
2. Maintenance Backlog
The backlog is a time indicator that stands for “maintenance delays”. It consists in the build-up of pending and planned activities per technician, regardless of being already in progress.
In other words, the backlog is the time needed to execute a reactive, preventive or predictive work order; quality control; improvements or any other activity that promotes the asset’s desirable performance. To calculate this metric, you need to take into account all the workflow in maintenance planning and control, which is typically managed through cmms software.
The value equals the sum of man-hour values for planned, pending and completed work orders, divided by the total available man-hours. Consider only the productive time of each technician, since they are not performing work orders 100% of the time!
Because it measures time, the result should be presented in hours, days, weeks or months, for example.
The standard backlog, measured in working days, is 2 weeks. For companies that work 24/7/, it’s somewhere between 3 to 4 weeks.
Effective backlog management often requires proper resource planning, including the use of inventory management software to ensure parts and materials are available when needed for scheduled work orders.
The advantage of this indicator is assessing the team’s productivity, as well as determining the causes behind them (if they are happening). From that point on, we recommend you enforce strategies to optimize production.
While you’re here, how about checking out our ultimate guide to maintenance management efficiency?
We’ve compiled 50 actionable tips over more than 20 pages of in-depth content on how to drive operational, asset and energy efficiency.
📌 Download it for free and make your operation more efficient today.

3. MTBF – Mean Time Between Failures
Another well-recognized key performance indicator is the MTBF, which measures reliability.
It takes into account random failures (unplanned), including those stemming from software failures and manufacturing defects. Failures that don’t put the asset out of service are not taken into account.
Since the result considers the time elapsed between each failure, it is also measured in time (hours, days, weeks or months). The longer the MTBF, the more reliable the asset – unlike the MTTR, which should be the lowest possible.
To calculate the MTBF, you need to subtract the total breakdown time from the total working time; and then divide it by the number of breakdowns.
The total working time may be 24 hours or the period during which equipment is operating. The total breakdown time includes all the time lost until it is up and running again.
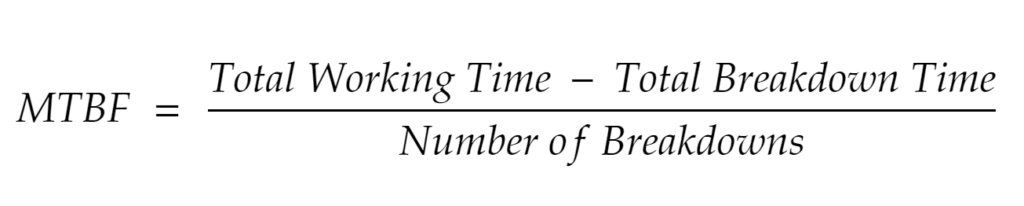
In this case, the global average varies according to the type of equipment or business. Nevertheless, it should be as high as possible. As time passes, compare it to previous results to see if it increases.
4. MTTR – Mean Time To Repair
The MTTR, which stands for Mean Time to Repair, is another common maintenance key performance indicator. It can be applied to an asset, a machine, a single component or a whole system. The MTTR considers the time it takes for your team to intervene or perform corrective maintenance after a failure has happened, which can be optimized through field service management software.
Unlike the MTBF, you should aim for the lowest MTBF possible. In a way, it also works as a trigger for making decisions that lead to maximum profits and minimal risks.
To calculate the MTTR, you will need to take into consideration the total amount of time spent on repairs after each failure during a certain period of time. Once you have the answer, divide it by the amount of failures reported during the same time period.
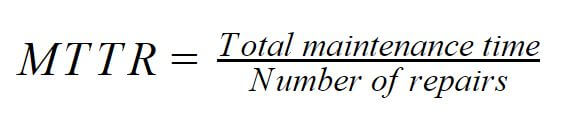
This way, you can estimate the amount of time (again, in hours, days, weeks or months) that a given asset was down – as well as what you should do to prevent it from happening again.
Like the MTBF, there isn’t a global standard that will suit every industry and every type of equipment. However, you should work to lower it as much as possible.
5. OEE – Overall Equipment Effectiveness
The OEE is one of the most important KPIs in maintenance. It measures the overall effectiveness of the company, which allows you to determine whether the processes you’ve put in place are efficient or not. As a standard rule, aim for an OEE at 77% or above.
One of the many benefits of calculating the OEE is finding out how often assets are available to work. You’ll become aware of how speedy the manufacturing process is and, last but not least, how many products (or services) are manufactured (or executed) without any kind of failure.
The formula is pretty simple. To calculate the OEE, multiply availability, performance and quality. We determine availability according to downtime and uptime, as we’ve covered. Performance is calculated by comparing current production against projections. Finally, quality comes from the total production minus the faulty production in a given sample.
Although the global mean is 77%, world-class companies sit snugly between 85% and 99%.
The OEE is closely related to two other KPIS, the OOE and the TEEP. Head this way to learn all about the OOE, the OEE and the TEEP.
6. PMP – Planned Maintenance Percentage
The planned maintenance percentage considers the time spent on planned activities (maintenance, repairs or replacements) on an asset. This maintenance KPI is directly linked to the company’s Preventive Maintenance Plan.
We take into account effectiveness, compliance and how each activity was performed, as well the time needed to complete it. Then, simply divide the total planned maintenance hours by the total maintenance hours. Multiply the result by 100 to get the percentage.
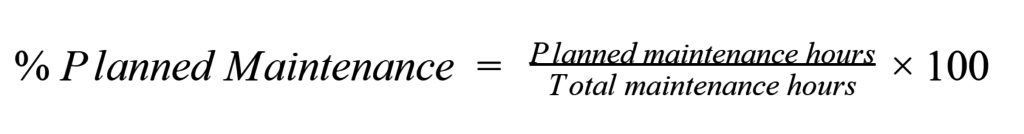
This result shows the level of effectiveness of the company, as well as its performance and success within its sector. To match global median values, PMP should be around 85% or above.
Organizations looking to implement comprehensive maintenance KPI tracking and achieve these performance targets may benefit from a cafm system that integrates all facility management functions into a single platform.
You may want to try an Intelligent Maintenance Management Platform to boost your results. If you’re interested in learning more, talk to one of our maintenance software specialists to schedule a demo.
7. Schedule Compliance/ Planned Maintenance Compliance
This KPI could not be missing from a list with the most important key performance indicators in maintenance. In short, it analyses the compliance with the plan you’ve established, which can be effectively tracked using compliance management software.
Or, better yet, the effectiveness and commitment technicians and managers showed on their planned tasks. Schedule compliance as a maintenance KPI measures the whole team’s performance, from the decision-makers to the people who comply with the plan day in and day out.
How many activities were performed according to the established guidelines? Generally, managers evaluate the date, the time it took to complete a task and efficiency. Compliance should be 90% or more.
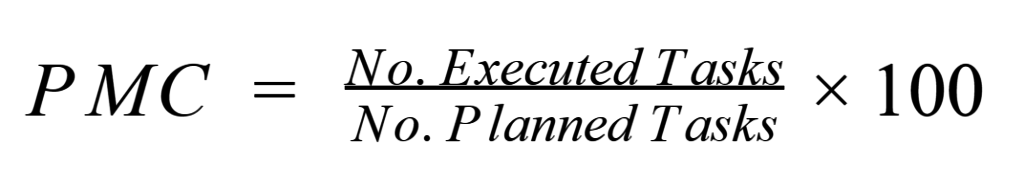
Using this indicator and assuring it falls within the average (or above) means that productivity is high, with minimal failure risks and losses.
Maintenance indicators for better decision-making
Arguably, the biggest advantage in calculating and applying maintenance key performance indicators is the deep knowledge and insight you’ll gain on internal processes and activities. Thus, you can understand what’s really working (or not), and where there’s room for improvement.
Establishing, complying and measuring your goals through maintenance KPIs is not just about ensuring the company will be productive, it also plays a significant role in motivating and growing the team.
Profit will stay healthy and within projections, without downfalls or losses. The company will also improve its reputation, since reliability tends to increase with the reduction of both risks and downtime.
Finally, you can avoid complaints from customers, which prevents customer service from becoming overwhelmed.