The only way to know if your asset management strategy is efficient is to analyse key performance indicators (KPIs). Asset management software with built-in performance indicators allows you to assess availability, reliability, functionality, and maintenance costs, as well as the quality of maintenance management.
Therefore, let’s recall what the main asset performance indicators are:
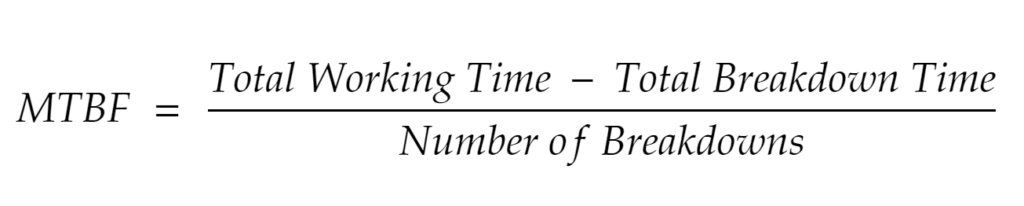
Mean Time Between Failures (MTBF)
The MTBF (mean time between failures) is one of the main indicators of asset reliability. As the asset approaches the end of its useful life, it is normal for failures to become more frequent. This means that the asset becomes less reliable and maintenance expenses increase. When the scales tip more towards expenses than towards benefits, it is time to replace the asset.
Mean Time To Repair (MTTR)
Mean time to repair (MTTR) is the average time required to repair an asset. MTTR is an indicator of maintainability, i.e., how easily can the asset be repaired. As time goes by, it is possible that MTTR will increase because breakdowns are increasingly complex – more difficult to diagnose, perhaps requiring parts replacement, and so on. At that point, you should compare repair costs and replacement costs.
When managing assets across multiple locations, field service management software becomes essential for tracking MTTR and other performance indicators consistently across distributed operations.

⚙️ Want to reduce reactive maintenance and lower MTTR?
Mean Time to Failure (MTTF)
Mean time to failure (MTTF) is an estimate of how long an asset will work until it fails completely. In other words, it is an indicator of the asset’s useful life. This performance indicator is important for assets that cannot be repaired, such as lamps or belts. If the equipment breaks down much sooner than expected, it may be over-operating… or the manufacturer may not be the best.
Overall Equipment Effectiveness (OEE)
Overall equipment effectiveness (OEE) is one of the key indicators of asset performance. OEE should be at least 77% and ideally be above 85%. See our article on OEE, TEEP, and OOE to understand which variable is failing and how you can improve your asset effectiveness.
A cafm system can enhance your asset performance analysis by integrating OEE tracking with space management and facility operations for a comprehensive view of equipment effectiveness.
Percentage of unplanned maintenance
What are the percentages of planned maintenance (or preventive maintenance) and unplanned maintenance (or reactive maintenance)? Unplanned maintenance should not exceed 10-20%. Consequently, planned maintenance should amount to 80-90%. If the percentage of unplanned maintenance is higher, conduct a root cause analysis to understand the source of failures. If they are predictable, invest in condition monitoring and proactive maintenance.
Maintenance cost (forecasted vs actual cost)
Another performance indicator to keep an eye on is the cost of maintenance. Compare the amount you forecasted for the asset (preventive maintenance) and the amount you actually spent (preventive and reactive maintenance costs). If there’s too big a gap between the two, it’s likely that the asset is in worse condition than you originally thought. It’s worth reviewing your maintenance plan and criticality assessment.
To accurately track maintenance costs and material expenses, inventory management software can help you monitor spare parts consumption and ensure you have the right components available when calculating these performance indicators.
🧮 Track maintenance costs: to have reliable data on your maintenance costs, you need to record all work orders on the same cmms software. The duration of each work order gives you an idea of how much you are spending on labour. If you also record the materials used and the expenses with suppliers, you get exact figures to calculate your costs.
Cost of preventive maintenance (evolution over time)
Still on the subject of costs, there is another performance indicator you should take into consideration: the evolution of preventive or predictive maintenance costs over time. If preventive maintenance costs rise but downtime and reactive maintenance costs do not fall or remain the same, then your plan is not being effective. Here are our recommendations for choosing the right maintenance strategy for each asset.
While optimising your maintenance strategy, don’t forget that compliance management software ensures your performance improvements align with regulatory requirements, maintaining both efficiency and compliance standards.
Replacement cost vs. repair cost
Finally, it is interesting to compare the replacement cost with the repair cost. Regarding the replacement cost, you should always have a reference value range. The cost of maintenance should encompass the value you have programmed for preventive maintenance and a forecast – based on the asset’s history – for reactive maintenance. When they come close together, you should consider buying another piece of equipment.
Failure resolution time
While not an indicator about the asset, it is a performance indicator for your team or your supplier. Measure the elapsed time between the creation and closure of the work order. If possible, also monitor how long it takes on average to assign a technician, as well as the time or number of visits required to reach a diagnosis. The faster the resolution of the fault, the more you optimise the availability of the asset.
For a holistic view of asset performance within your broader operations, facility management software integrates asset performance monitoring with facility operations, giving you complete visibility into how maintenance strategies impact overall performance.
Are you sure you have real information about all these performance indicators of your assets? If in doubt, change your software. An intelligent maintenance platform is the best way to capture valuable data about your operation and generate automatic reports.